While working on a d3 timeline for another post, I came across a beautiful timeline library, d3-milestones, and knew that I wanted to use it. I’ve also wanted to play with WikiData for a long time, so I combined these two interests by grabbing data from Wikidata and visualizing it using d3-milestones. There’s another chart that I want to try out later in this post, so this first example will be straightforward: Stephen King novels by publication date.
After scrolling through this tutorial, I was able to modify this sample query to get what I wanted:
SELECT DISTINCT
  ?book
  ?bookLabel
  ?authorLabel
  (GROUP_CONCAT(?genre_label; SEPARATOR = ", ") AS ?genres)
  (MIN(?publicationDate) AS ?firstPublication)
WHERE {
  ?author rdfs:label "Stephen King"@en.
  ?book wdt:P50 ?author.
  OPTIONAL {
    ?book wdt:P136 ?genre.
    ?genre rdfs:label ?genre_label.
    FILTER((LANG(?genre_label)) = "en")
  }
  ?book wdt:P7937 wd:Q8261;
    wdt:P577 ?publicationDate.
  SERVICE wikibase:label { bd:serviceParam wikibase:language "en". }
}
GROUP BY ?book ?bookLabel ?authorLabel
ORDER BY ?firstPublication
Cross-referencing the Wikidata query results with Stephen King’s novels bibliography on Wikipedia, I see several errors on the Wikidata side:
- includes six additional entries for novellas
- includes a short story collection (mis-categorization)
- includes a duplicate Spanish title for an existing novel
- is missing five novels that Wikipedia has
- is missing three novels by Richard Bachman, King’s pen name
- has different publication dates for two novels
Most of these data issues can be addressed by modifying the query, but I’m lazy so we’ll move on. Exporting, transforming, and feeding this data to d3-milestones gives this nice chart:

I also learned that Wikidata offers nice built-in and interactive visualizations. The view in the iframe below starts off narrow, but you can CTRL+SCROLL to zoom-in.
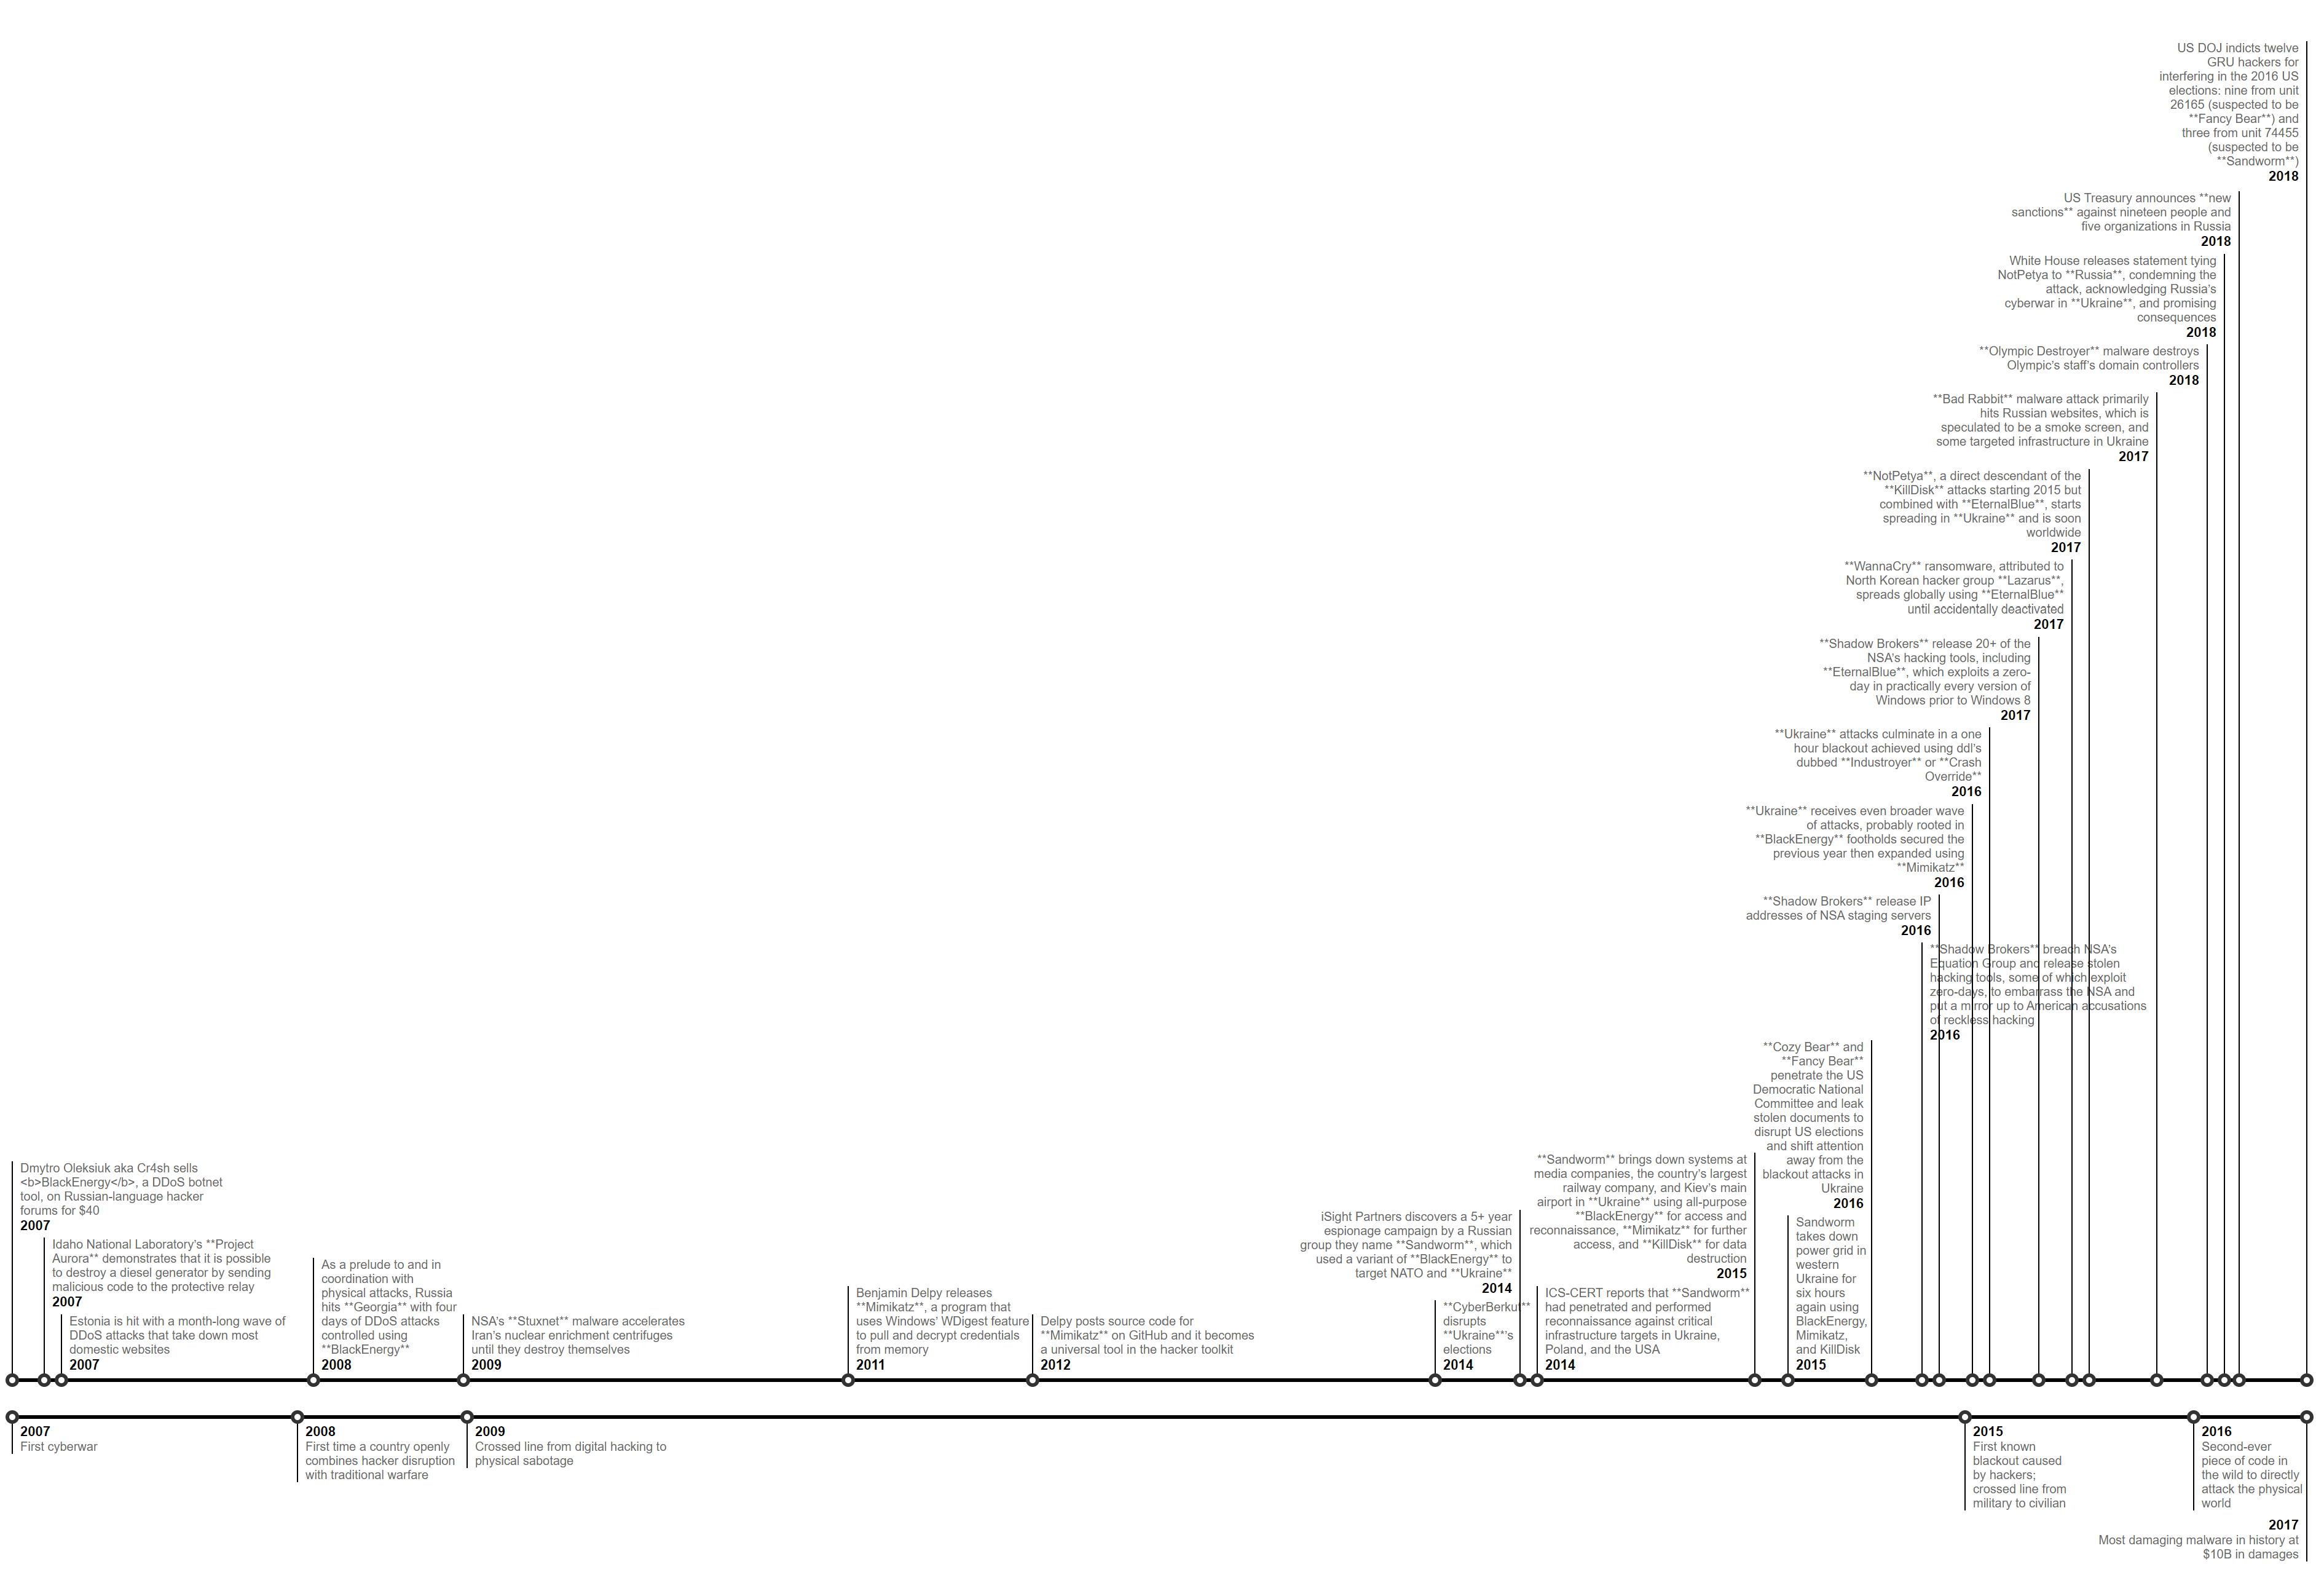
Last year, I manually created a timeline for the events in the book Sandworm by dragging and dropping in LibreOffice Draw. I was enamoured with the timeline style in the Economist and wanted to replicate it:
- first year is four digits and subsequent year are two digits
- color-coded events
- utilizing both sides of the timeline, i.e. top tracks events and bottom tracks milestones
- bending the event stems to create rectangular nooks for long text
This is what the final product looked like:

And this is what the same data looks like using d3-milestones:
ouch. Not too good. I should have suspected that all the text on the right side would get squished because d3-milestones doesn’t support elbow bends. 🤷